The useful bits
- Compare like-for-like objectives, markets and account sizes before using the reported benchmarks.
- Start with the same campaign objective and reporting period, then separate markets and conversion definitions.
What the source covers
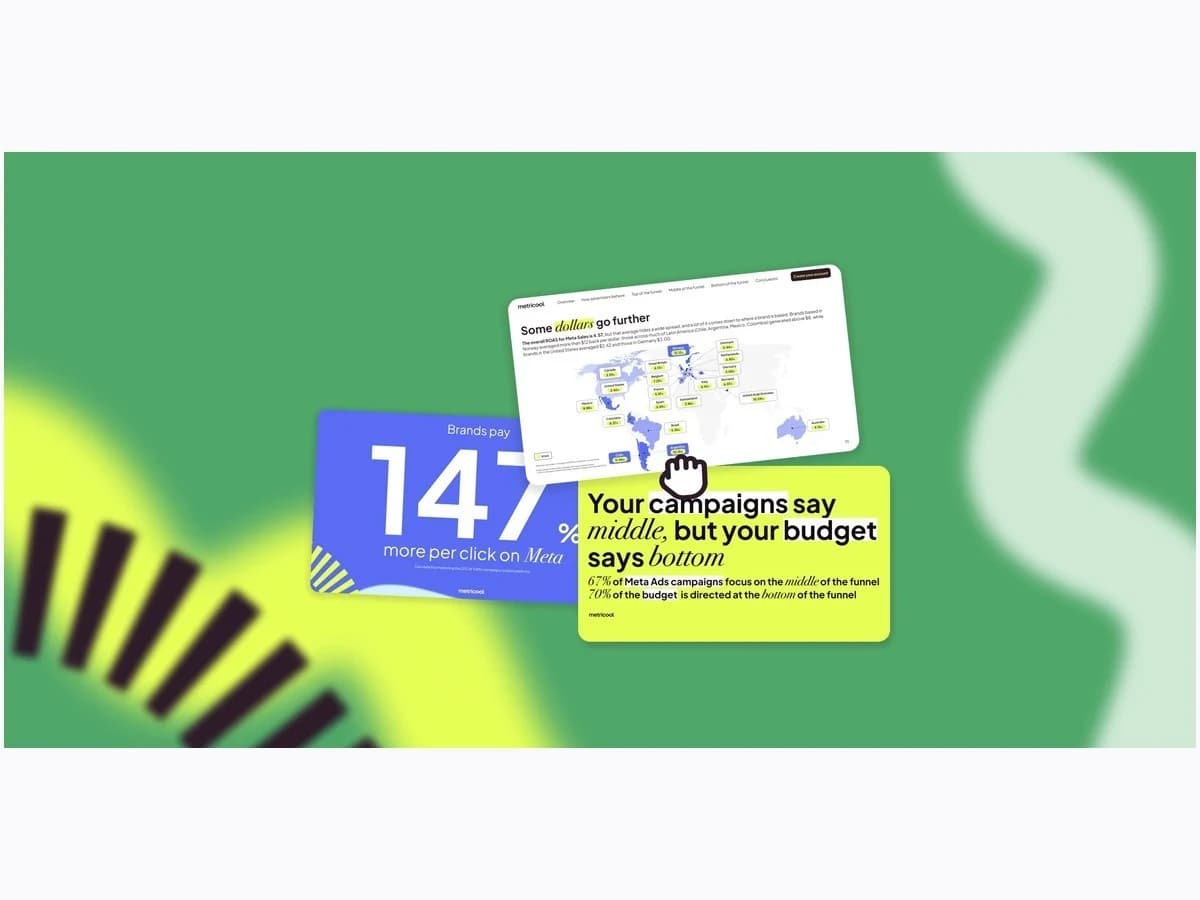
Metricool’s study covers 628,969 campaigns and compares January–June 2025 with the same period in 2026. Treat the figures as context from its advertiser sample. Differences in objectives, markets and advertiser mix prevent a simple conclusion that one platform will be cheaper or more profitable for your business. Use the benchmarks to frame questions, then compare like-for-like outcomes in your own accounts.
Build a comparable benchmark
Start with the same campaign objective and reporting period, then separate markets and conversion definitions. Use your own cost and outcome trends as the baseline. If the external sample differs from your account mix, use the difference to formulate a question about creative, audience or auction conditions instead of resetting targets to a headline average.
Reading scope
The public study summary was reviewed. The gated report was not accessed; its sample should not be treated as a universal benchmark.
Keep learning
What would you add?
Bring your experience to the conversation. The next useful perspective could be yours.
Talk with the collective