Meta · Status at source date: Official announcement
Meta's ad revenue grew 26% as prices per ad rose 14%
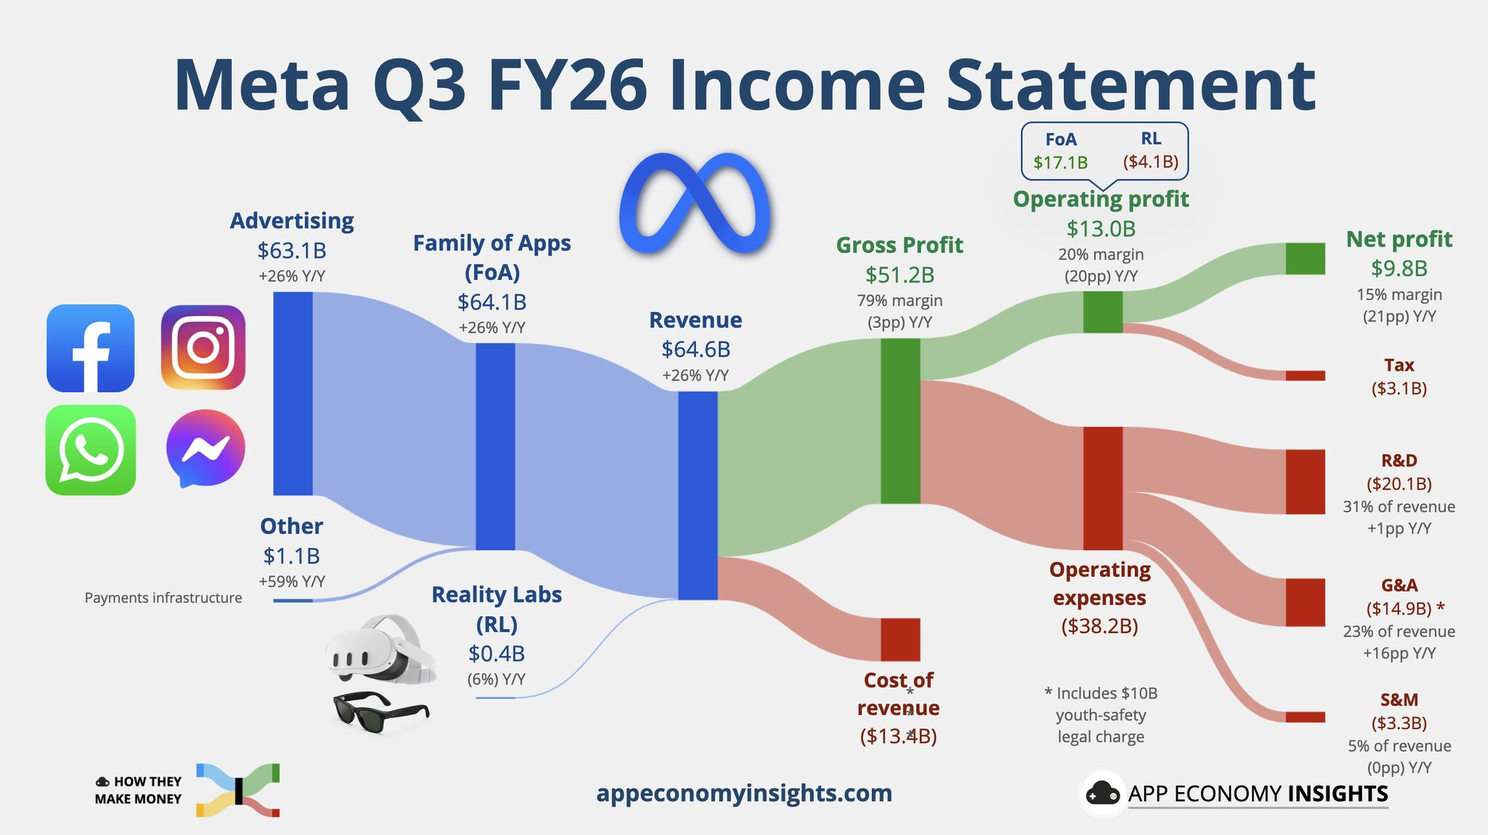
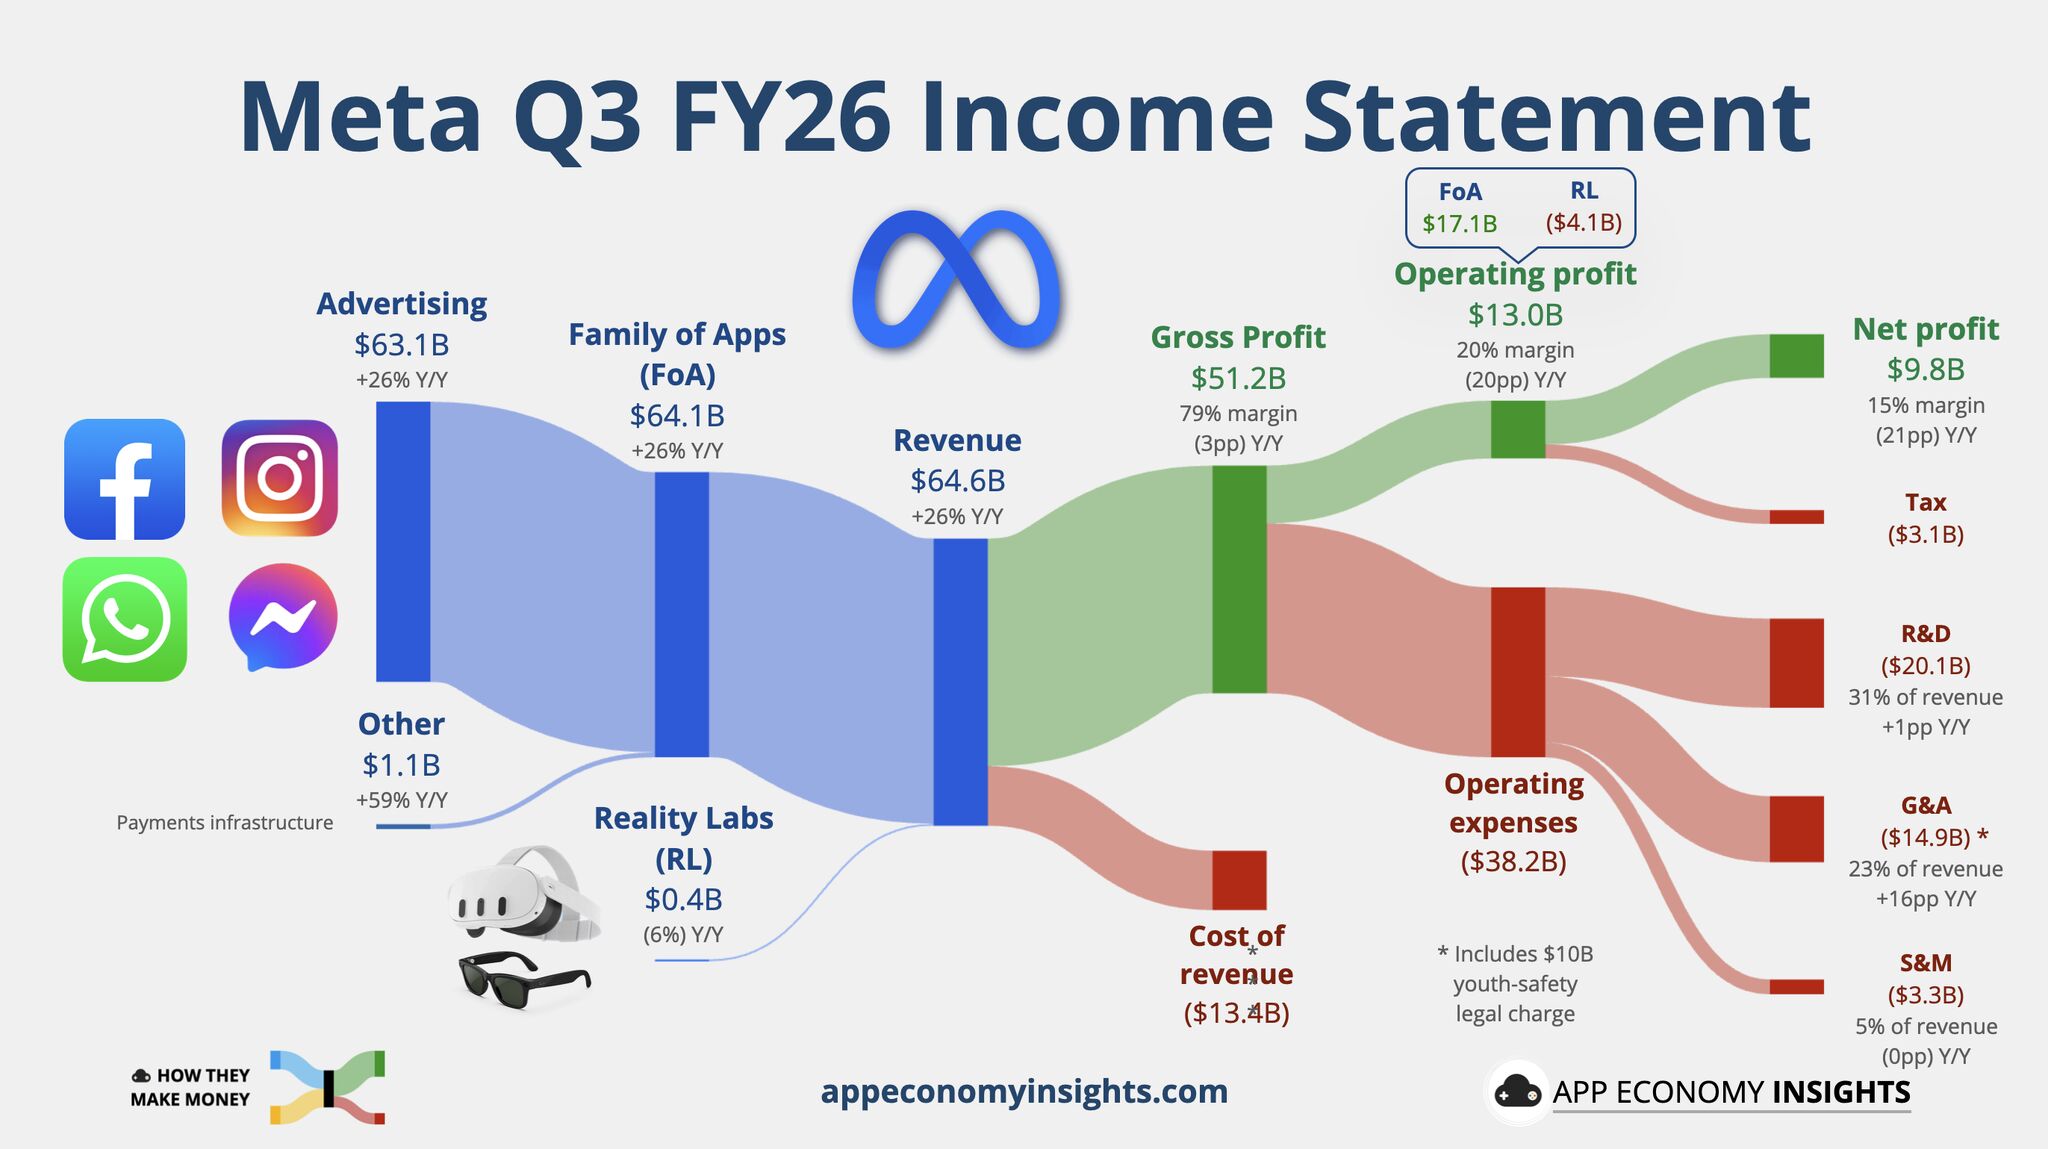
Meta reported Q3 advertising revenue of $63.061 billion, up 26% year on year, alongside 10% growth in ad impressions and a 14% rise in average price per ad. Bertrand Seguin shared analysis of the results. These are company-wide measures combining markets, objectives and inventory; they are not a forecast for an individual account’s CPM or acquisition cost. When reviewing holiday budgets, compare your own placement mix and conversion performance before attributing a cost increase to Meta’s headline average.
What changed
Week 43 follow-up: 2026-10-21
Earlier coverage and context (2026-10-21)
Meta reported advertising revenue of $63.061 billion for the third quarter of 2026, an increase of 26% year on year. The results, released on 21 October, also report 10% growth in ad impressions and a 14% increase in the average price per ad.
These are company-wide measures across Meta's advertising business. They do not describe the change in CPM, CPC or acquisition cost for a particular advertiser, market or placement. Impression growth and average-price growth are useful signals about the overall business, but they combine many different campaign mixes.
For campaign planning, the distinction matters. A retailer whose CPM rose should investigate its own audience, placement mix, creative and auction conditions rather than attribute the entire change to the headline average. Similarly, growing platform revenue does not establish that an individual campaign became more effective.
A practical account review can compare equivalent periods, objectives and placements, then separate delivery volume from cost and downstream conversion performance. That makes the company results useful context without turning an aggregate financial statistic into an account benchmark.
The announcement includes broader company financial and AI commentary. This update focuses on the advertising metrics; it is not a new Ads Manager feature or a forecast of future campaign returns.
For a useful internal comparison, keep platform delivery and business results in separate columns: impressions, spend, CPM, attributed conversions and revenue or qualified leads. Then note any changes to campaign objectives or attribution settings between periods. This prevents a platform-wide growth number from becoming a misleading target for the media team. The quarterly release is a dated source for the aggregate figures; it cannot diagnose why one advertiser's costs or conversion quality changed.
Sources & contributor credit
- Official sourceMeta
Original announcement dated 2026-10-21.
- Source referenced in newsletterMeta press release (SEC)
Linked in Yoann Ferrand’s published Week 43 newsletter.
- Source referenced in newsletterBertrand Seguin
Linked in Yoann Ferrand’s published Week 43 newsletter.
- Newsletter coveragePaid Media Collective
Published Week 43 edition; source for the approved credit, image and wording reconciliation.


Original creator unverified
Credits reflect the editor's latest changes. Original authorship has not been independently verified for this version.
Attribution evidence and limitations
Full attribution review pending.
A source link alone does not establish original authorship.
Original image and video creators have not yet been verified.
- Published on this site
- Article updated
This update reflects the dated source reporting. Availability may have changed. Further coverage of this same development will be added to this page.

