The useful bits
- Use the analysis to review contribution margin after fulfilment, fees and advertising for each channel. Keep the platform revenue comparison separate from a SKU’s cost calculation.
- Prime Day moved between quarters. The analysis is not evidence that seller CPCs or individual fees rose by the same percentage.
What the source covers
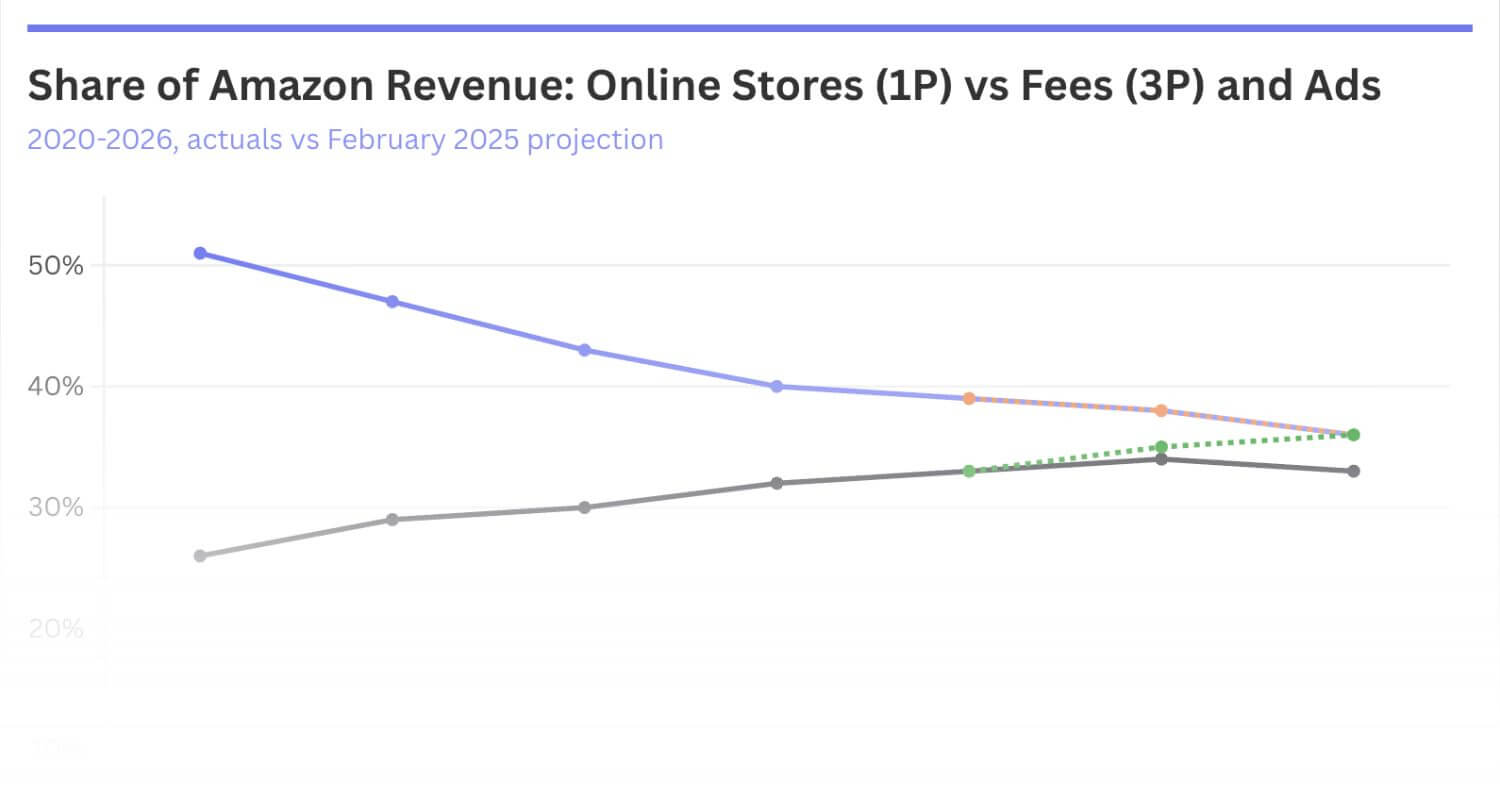
Ben Donovan compares Amazon’s $66.1 billion in third-party seller services and advertising with $68.5 billion in its own online-store sales in Q3. The resulting 96.6% is a ratio between company revenue lines, not a fee charged to a seller.
Use it in your next review
Use the analysis to review contribution margin after fulfilment, fees and advertising for each channel. Keep the platform revenue comparison separate from a SKU’s cost calculation.
Read the evidence in context
Prime Day moved between quarters. The analysis is not evidence that seller CPCs or individual fees rose by the same percentage.
Keep learning
What would you add?
Bring your experience to the conversation. The next useful perspective could be yours.
Talk with the collective