Google Ads · Status at source date: Newsletter archive
PMax gains native channel performance over time view
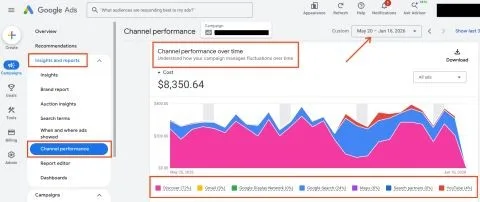
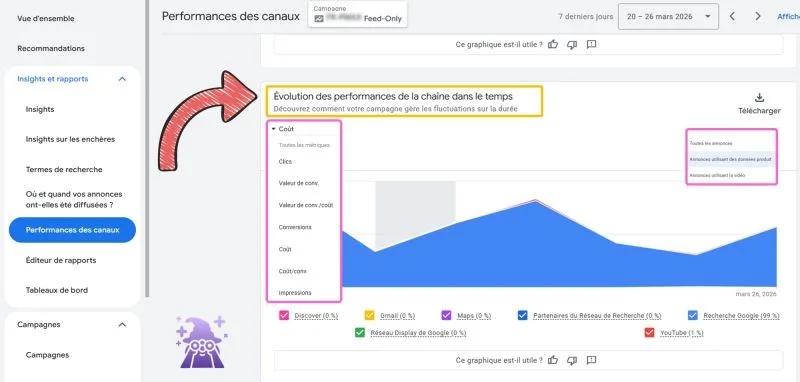
Axel Falck has spotted a new native view in Performance Max called "Channel performance over time," displaying how each channel (Search, YouTube, Display, etc.) contributes to results as a stacked time-series graph, with a filter to toggle between performance metrics and investment. The view was previously only available via custom scripts.
What changed
The format makes it immediately visible when one channel is dominating: typically Search in feed-only Shopping configurations: and how that distribution shifts over time.
Why it matters for advertisers
For you, this means faster diagnostics for PMax channel imbalances: access them directly from the PMax campaign interface and use them to identify whether video or Display placements are genuinely utilised or whether spend is collapsing to a single channel.
Perspective from the original PMC newsletter.Sources & contributor credit
- Newsletter coverage · Paid Media Collective newsletter
Original newsletter text, contributor labels and media for this update.
- Source referenced in newsletterLinkedIn
Linked from the original newsletter. The source publication date has not been independently confirmed.
Original creator unverified
The names below are source credits. The original creator and first-reporting priority have not yet been independently verified.
Attribution evidence and limitations
Full attribution review pending.
A source link alone does not establish original authorship.
Original image and video creators have not yet been verified.
- Published on this site
This update reflects the dated source reporting. Availability may have changed. Further coverage of this same development will be added to this page.
Original newsletter text and archive evidence
PMax gains native channel performance over time view
Axel Falck has spotted a new native view in Performance Max called "Channel performance over time," displaying how each channel (Search, YouTube, Display, etc.) contributes to results as a stacked time-series graph, with a filter to toggle between performance metrics and investment. The view was previously only available via custom scripts. The format makes it immediately visible when one channel is dominating: typically Search in feed-only Shopping configurations: and how that distribution shifts over time.
For you, this means faster diagnostics for PMax channel imbalances: access them directly from the PMax campaign interface and use them to identify whether video or Display placements are genuinely utilised or whether spend is collapsing to a single channel.
Source captured . No explicit first-contributor label was provided for this update.