Google Analytics · Status at source date: Officially announced
GA4 adds native dashboards to Reports
Google confirms native GA4 dashboards. Current limits exclude segments, API support and card-level comparisons; scorecards can still compare date ranges.
What changed
Google's release notes document Dashboards on 9 September 2026. The earlier 31 August newsletter credited Julius Fedorovicius with an observation about the rollout. That historical credit is retained, but the original linked post and newsletter edition were inaccessible during the independent review. The credit does not establish exclusive first reporting, ownership of the observation or authorship of the accompanying image.
The current help page says an Editor or Administrator can create and publish dashboards. Anyone with access to the property can view its published dashboards. A standard property supports up to 15 cards per dashboard; a premium property supports up to 30. Teams should treat publication as sharing within the property and check which colleagues have access before publishing a stakeholder view.
The limitations need precise wording. Google lists API support, segments and card-level comparisons as unsupported. That is narrower than saying all comparisons are unavailable: scorecards can show percentage changes when a comparison date range is selected. The distinction matters when deciding whether a routine period-over-period view can stay inside Analytics.
For a weekly review, choose cards around the decisions the team needs to make and agree the date ranges before interpreting a change. Compare the dashboard with the reports colleagues already rely on, and investigate differences in definitions or periods. These are reporting checks to perform, not results established by Google's announcement or a test of a particular account.
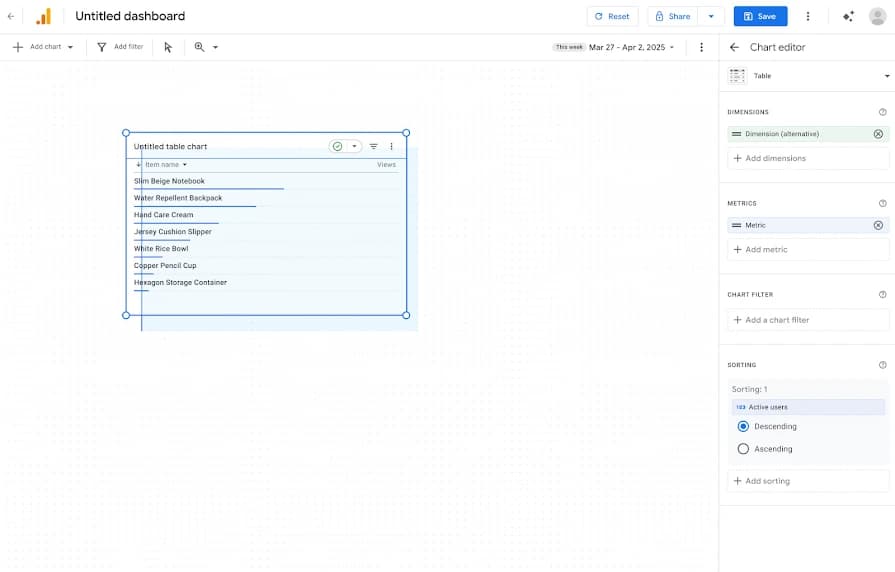
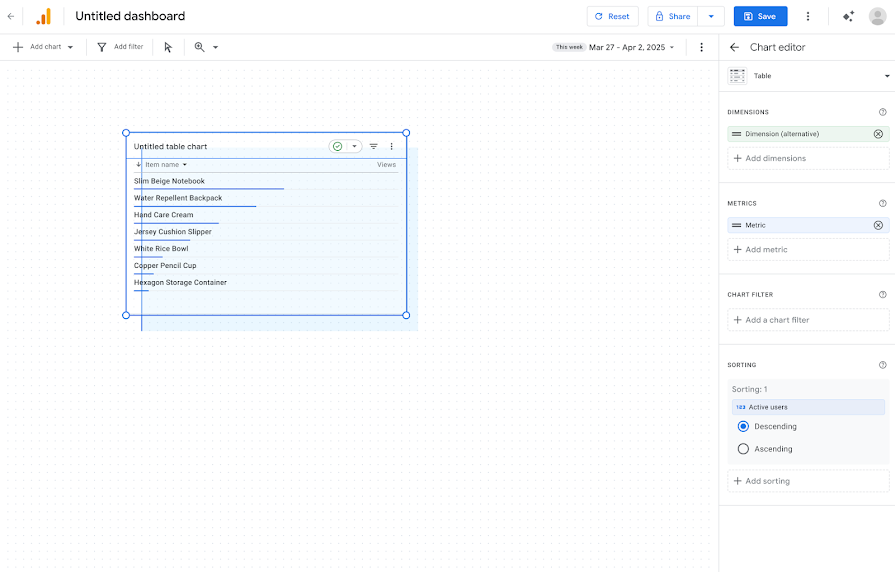
The lead image shows the Google Analytics dashboard editor and its card configuration. It was visually checked during the Week 37 reconciliation and is stored locally with Google Analytics credited. It illustrates the interface, not a performance or revenue outcome. The older newsletter remains evidence for its original contributor credit; it does not establish ownership of the product screenshot.
Why it matters for advertisers
Confirm the decisions a dashboard should support before building it. Agree metric definitions, date ranges and an owner, then compare totals with the reports stakeholders already use. Keep an alternative reporting workflow for requirements the native dashboard does not support. Documentation confirms the described feature, not access or behaviour in a particular account.
What to check next
- Check whether the property offers Dashboards and who can publish them.
- Choose a focused set of cards within the documented property limit.
- Distinguish date-range comparisons from unsupported card-level comparisons.
Sources & contributor credit
- Observation credited in newsletterJulius Fedorovicius
Named post linked by the original newsletter. The post and newsletter edition were inaccessible in the independent 12 September review. Existing newsletter credit is retained, not independently verified first reporting or visual authorship.
- Official release announcement · Google Analytics release notes: Dashboards
Google is the publisher. The Dashboards entry is dated 9 September 2026. Checked 12 September; this confirmation does not replace the earlier newsletter coverage date.
- Official product documentationGoogle Analytics Help
Google is the publisher. The independent 12 September review confirmed roles, 15/30-card limits, unsupported API support, segments and card-level comparisons, and supported scorecard date comparisons. No independent publication date is established.
- Newsletter coverage · Paid Media Collective newsletter
Historical newsletter coverage and existing contributor credit. The edition could not be independently reopened during the 12 September review. Paid Media Collective is the curator; original visual authorship remains unverified.


Original creator unverified
Credits reflect the editor's latest changes. Original authorship has not been independently verified for this version.
Attribution evidence and limitations
Full attribution review pending.
A source link alone does not establish original authorship.
Original image and video creators have not yet been verified.
- Published on this site
- Article updated
This update reflects the dated source reporting. Availability may have changed. Further coverage of this same development will be added to this page.
Original newsletter text and archive evidence
GA4 introduces native drag-and-drop dashboards
Google Analytics is rolling out lightweight dashboards inside the Reports area for users with sufficient editing access. Cards can be added, moved, resized, and published into the left navigation, with up to 15 cards in standard properties and 30 in Analytics 360; API access, segments, and comparisons are not yet supported. For you, this means routine stakeholder views can stay inside GA4, so use the feature for compact monitoring while keeping deeper modelling and governed blends in Looker Studio or the warehouse.
Source captured . First-contributor labels follow the newsletter’s explicit wording.